We Go Beyond.
Innovative Solutions
Gravis Tech designs and deploys technical solutions that convey complex ideas. Using Data Analytics, Data Visualization, and Technical Communications tools, we create new ways to analyze, see, and share data.

Data Analytics
Business Intelligence
Geographic Information Systems
Dashboards (KPIs)
Data Warehousing
Design & Development
Data Visualization
Augmented Reality
Virtual Reality
Virtual Tours
360 Photos / Videos
Gamification
Technical Communications
Website Systems
(Public & Private)
Custom Software Development
Corporate Branding
Marketing Strategy & Products
We Go Beyond.
Rocket-Fueled Data
Data Analytics
Ask meaningful questions. Get meaningful results.
We start by asking hard questions about the purpose for the project and then create communication plans. All projects have a communication plan. Once we understand the goal of the project, we can design analytics that derive meaningful information out of the system.

Business Intelligence

Dashboards
(KPIs)

Geographic Info Systems

Data
Warehousing

Database Design & Development
Data Analytics Case
The Theodores
Litter Cleanup Tracker
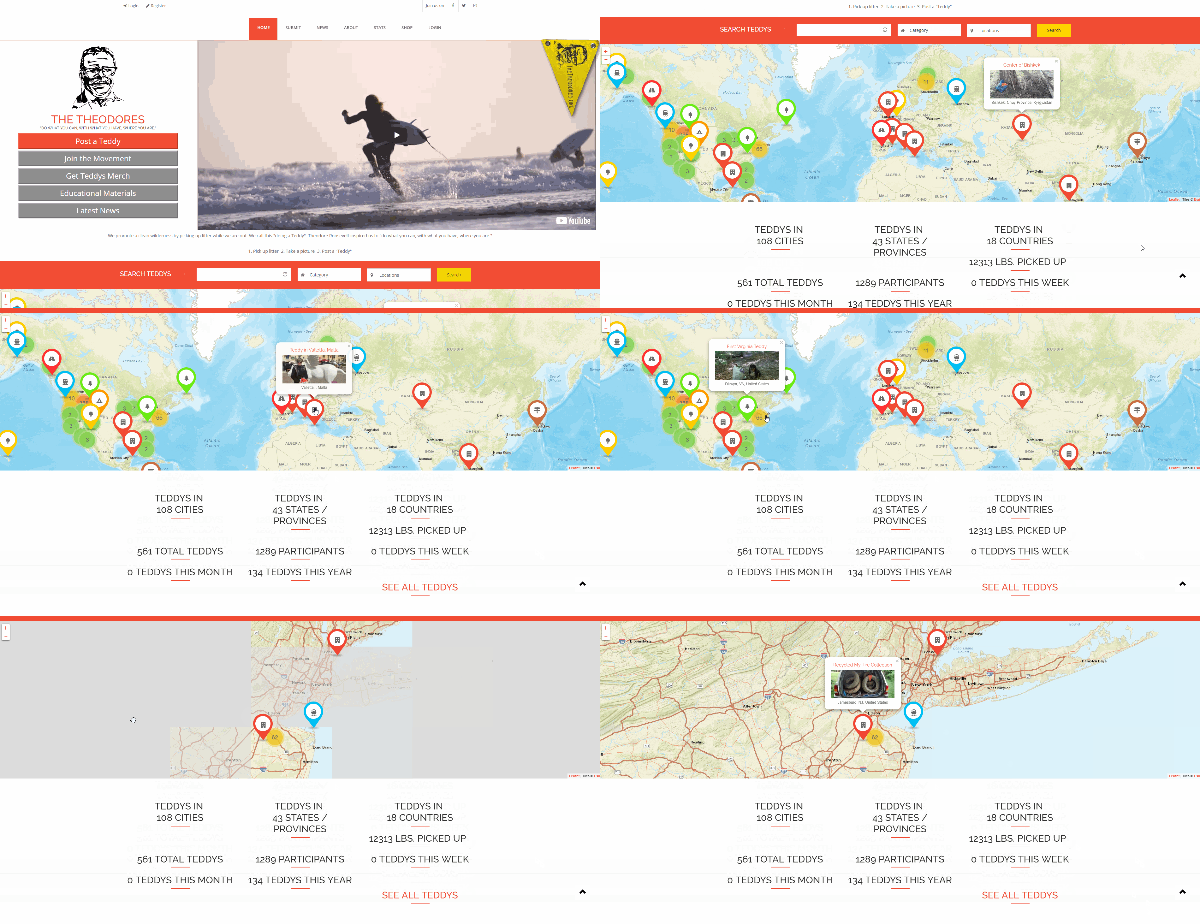
The Theodores is a grassroots community activist group that seeks to inspire people to clean up littered areas. Participants perform “Teddy’s” by participating in a litter cleanup activity. Prior to the development of this data system, The Theodores leaders used multiple web systems to communicate to stakeholders. They used a WIX website, a WordPress blog, and Facebook. Tracking their global progress was difficult because they manually tracked their cleanup statistics. We were able to consolidate their workflow into one easy to use, dynamic website that incorporates mobile friendly user forms and dynamic statistical reporting.
We went beyond by helping integrate the site with the group’s social media network. We recognize that the biggest path for growth for any social movement is through social media. So, when users enter “Teddy’s” using their mobile devices, content is automatically pushed to Facebook. Automation of social media content ensures users are engaged and constantly reminded to participate.
“Gravis Tech created a website that helps us track user data and encourages user participation in unique and visual ways. They are constantly looking for ways to improve our site, available to fix any issues that arise and suggesting new solutions. Their customer service is excellent and they always go above and beyond to help us. They did a great job of listening to our wants and needs and we are very satisfied with the product they delivered.”
Dylan Stegemeir, Founder
The Theodores
We Go Beyond.
Space-Age Visuals
Data Visualization
3D visualizations help you to see your data in new ways.
It takes exponentially more brainpower to try to visualize your data in 2D. By utilizing the 3rd dimension, we can employ our natural brain to recognize patterns, consume more data, and make relevant connections. This makes data we collect more useful.
We employ many unique visualization techniques. Our solutions range in complexity to meet your needs. Contact us to discuss how to integrate an engaging visualization into your project or presentation.
360
Photos
360
Video
360
Tours
Virtual
Reality
Augmented
Realty
Gamification
Data Visualization Case
Idaho National Laboratory
3d wayfinding Simulation
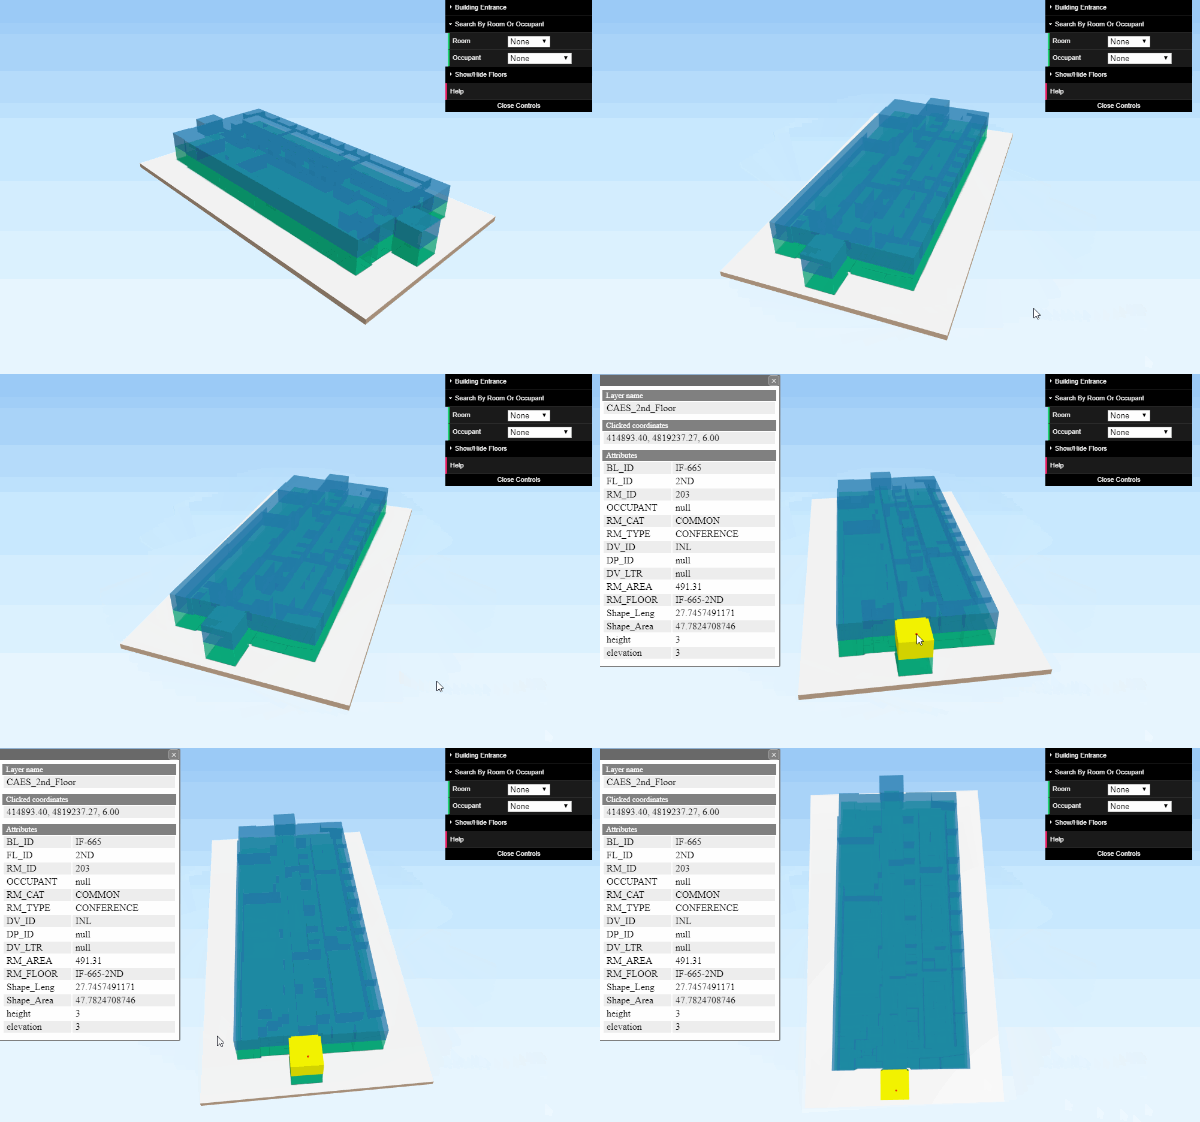
Our data visualization team was tasked with researching technologies to produce a mobile web-based 3D wayfinding application for the Idaho National Laboratory’s (INL) Space Management Program (SMP). The INL campus is comprised of multiple buildings in Idaho Falls, ID, as well as outside of the city on the 890 square mile INL complex. The buildings are often large and complex and difficult for employees and visitors to navigate. Many of the buildings have 2D maps that are difficult to read and can be time consuming to maintain. They were interested in developing an interactive 3D mobile wayfinding application. If developed, the application will help users locate corridors, stairwells, exits, conference rooms, cafeterias, co-work spaces, and individual offices. The final deliverable for this project was a report detailing our findings and a simple proof of concept pictured above.
While there are many commercially available products that accomplish this goal, our client had unique constraints that made using standard off the shelf software difficult. Our deliverable was to provide a comprehensive report describing the current state of available technologies.
We went beyond by providing a proof of concept and a work plan that described how their team could accomplish the final implementation with very little software investment.
Technologies used : ESRI (ArcScene, CityEngine, ArcMap, ArcGISOnline, Portal), QGIS, ThreeJS, PlayCanvas, Blender4Web
“We found Gravis Tech to be cost-effective, prompt and courteous to work with. Finding a company that is forward thinking, proactive and attentive to our needs is important to us.”
Joe Close
South Fork Coeur d’Alene River Sewer District
We Go Beyond.
Mission Critical
Technical Communications
Design and deploy mission critical technical communications that convey complex ideas and data.
Our team understands how to communicate complex scientific ideas and technology. The depth of our team ensures that your message is communicated clearly and concisely at all stakeholder levels. Many of our technologists have scientific backgrounds and understand how to best communicate new concepts and technologies. We often employ visual tools and graphics to help clients illustrate and communicate specific data sets and research that they wish to convey to a variety of targeted audiences.
Research
Create
Communicate
Data Management Case
Spokane Regional Health District
Community Health Insights
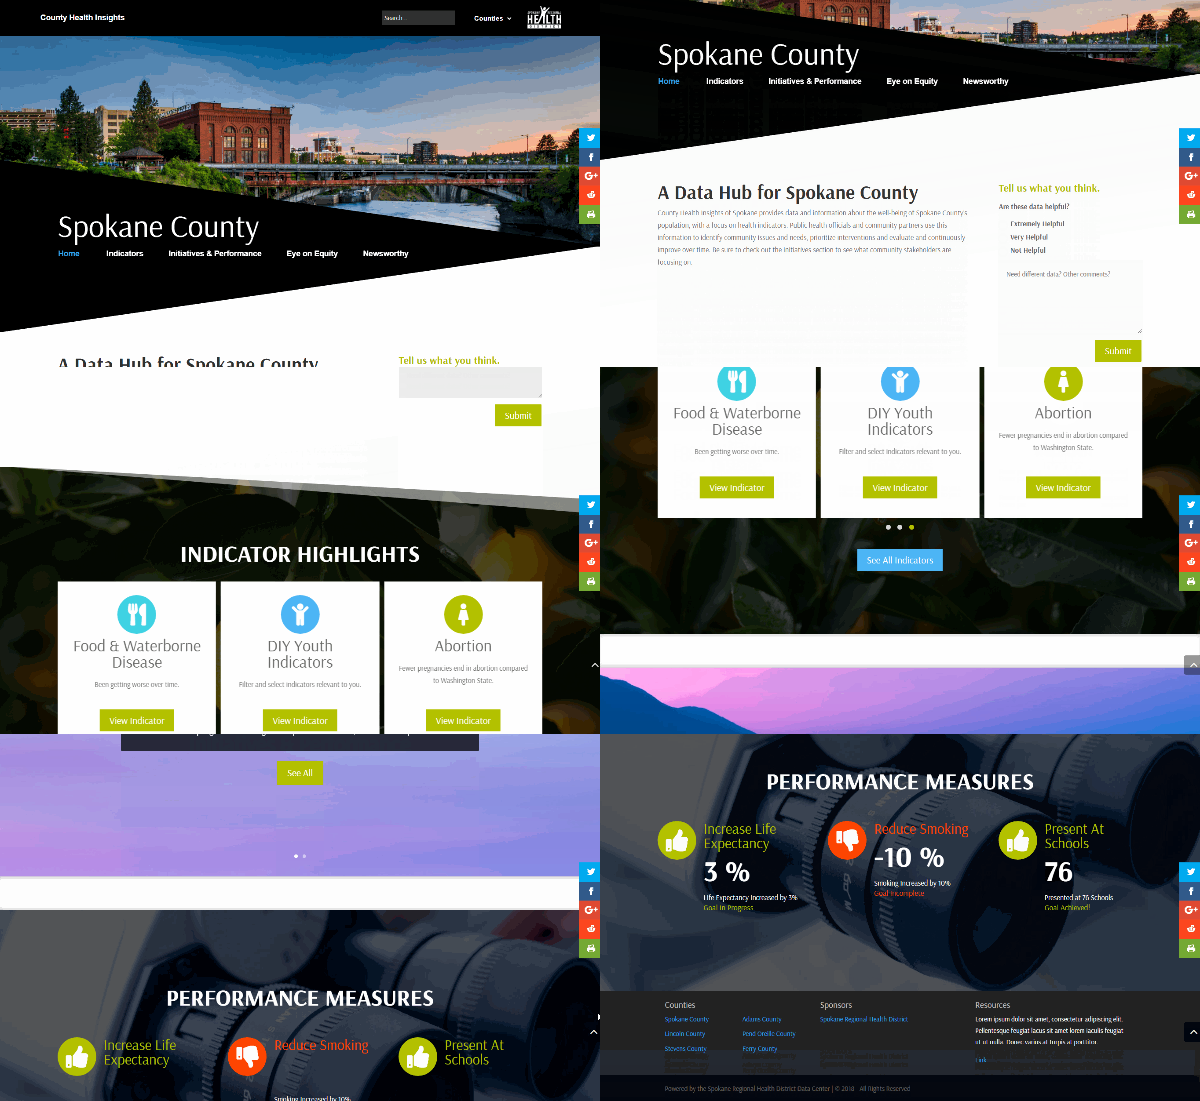
Gravis Tech worked with Spokane Regional Health District (SRHD) to provide an online, one-stop-shop web based data portal for community and population-based data sets. Through this effort, website users now have access to a variety of data and information sets summarized and prepared for public use. This portal enables local communities to utilize public health data to inform policy and program decisions. Our scope included working with the SRHD Data Management Group to create a highly customized website on a very tight project schedule.
We went beyond by performing a robust requirements gathering process to help the customer design their vision for the final product. During project initiation, it became clear that more design discussions were needed. We pivoted our project schedule and worked closely with the project team to produce a product we are all proud of.
Corporate Facts
A few facts about our company:
- SAM UNIQUE ID: M5JUJZNAZTA4
- DUNS: 079703509
- CAGE: 7BLA8
- PRIMARY NAICS CODE: 541511; SECONDARY: 541330, 541370, 541430, 541512, 541519, 541690, 541715, 541990
- SBA Certifications
- Washington State Office of Minority & Women's Business Enterprises (OMWBE)
Center of the Universe
Our team members are located throughout the Pacific Northwest. Our headquarters are located in historic Wallace, Idaho (AKA "The Center of the Universe").
Contacts
Email:
contact@gravistech.com
Phone:
+1 (844) 472-8471